Everyone hopes they won’t be involved in a car accident, but auto wrecks are all too common on Chicago roads, with over 85,000 traffic collisions reported in 2022. However, there is some good news—in 2023, Chicago recorded a 27 percent reduction in traffic fatalities from the peak in 2021, compared to 5 percent nationwide.
Chicago car accident prevention begins with understanding the statistics and taking precautions while on the road. Knowing when and how accidents take place can help drivers and others on the road stay vigilant and avoid injury. Our experienced auto collision attorneys are here to help keep you informed about Chicago car accident trends to help keep you safe on the road.
The Most Common Types of Car Accidents
There are several types of car accidents, and they are classified by the location of impact as follows:
Rear-ends
Head-ons
Sideswipes
Multi-car collisions
Rollovers
T-bone/side impact crashes
Single-vehicle accidents
Hit and runs
Blind-spot accidents
If you were in any of these collisions, a Chicago car accident lawyer who understands the stats can review your case and seek compensation.
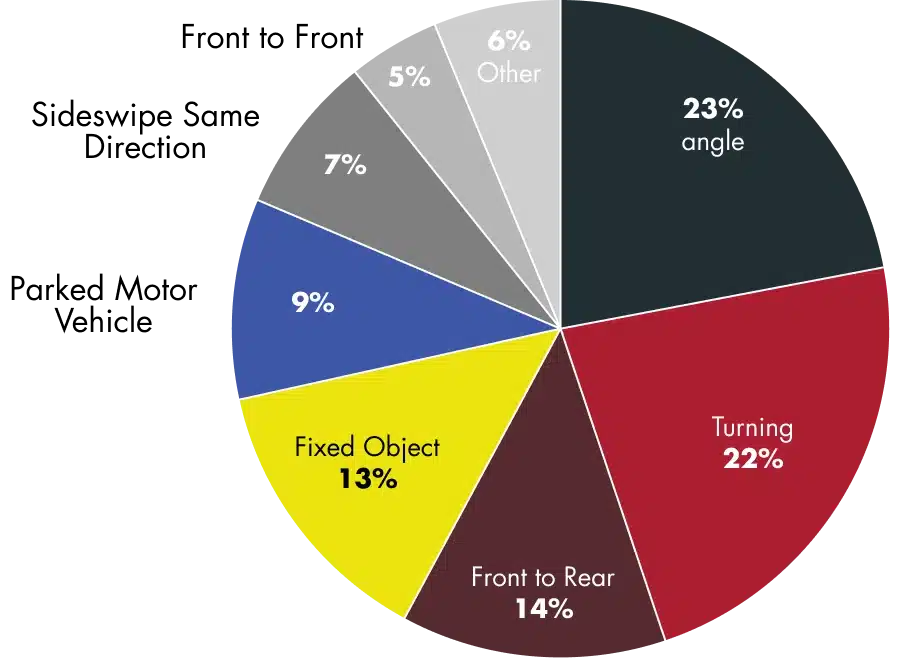
Chicago Crash Type Statistics 2023
Crash Types Resulting in Fatality or Injury
Single-Vehicle vs. Multi-Vehicle Crashes Resulting in Fatality or Injury
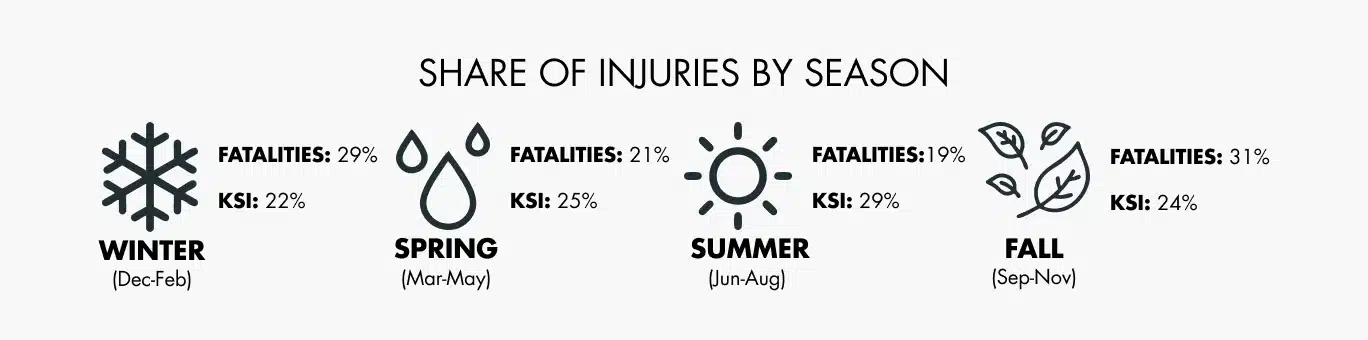
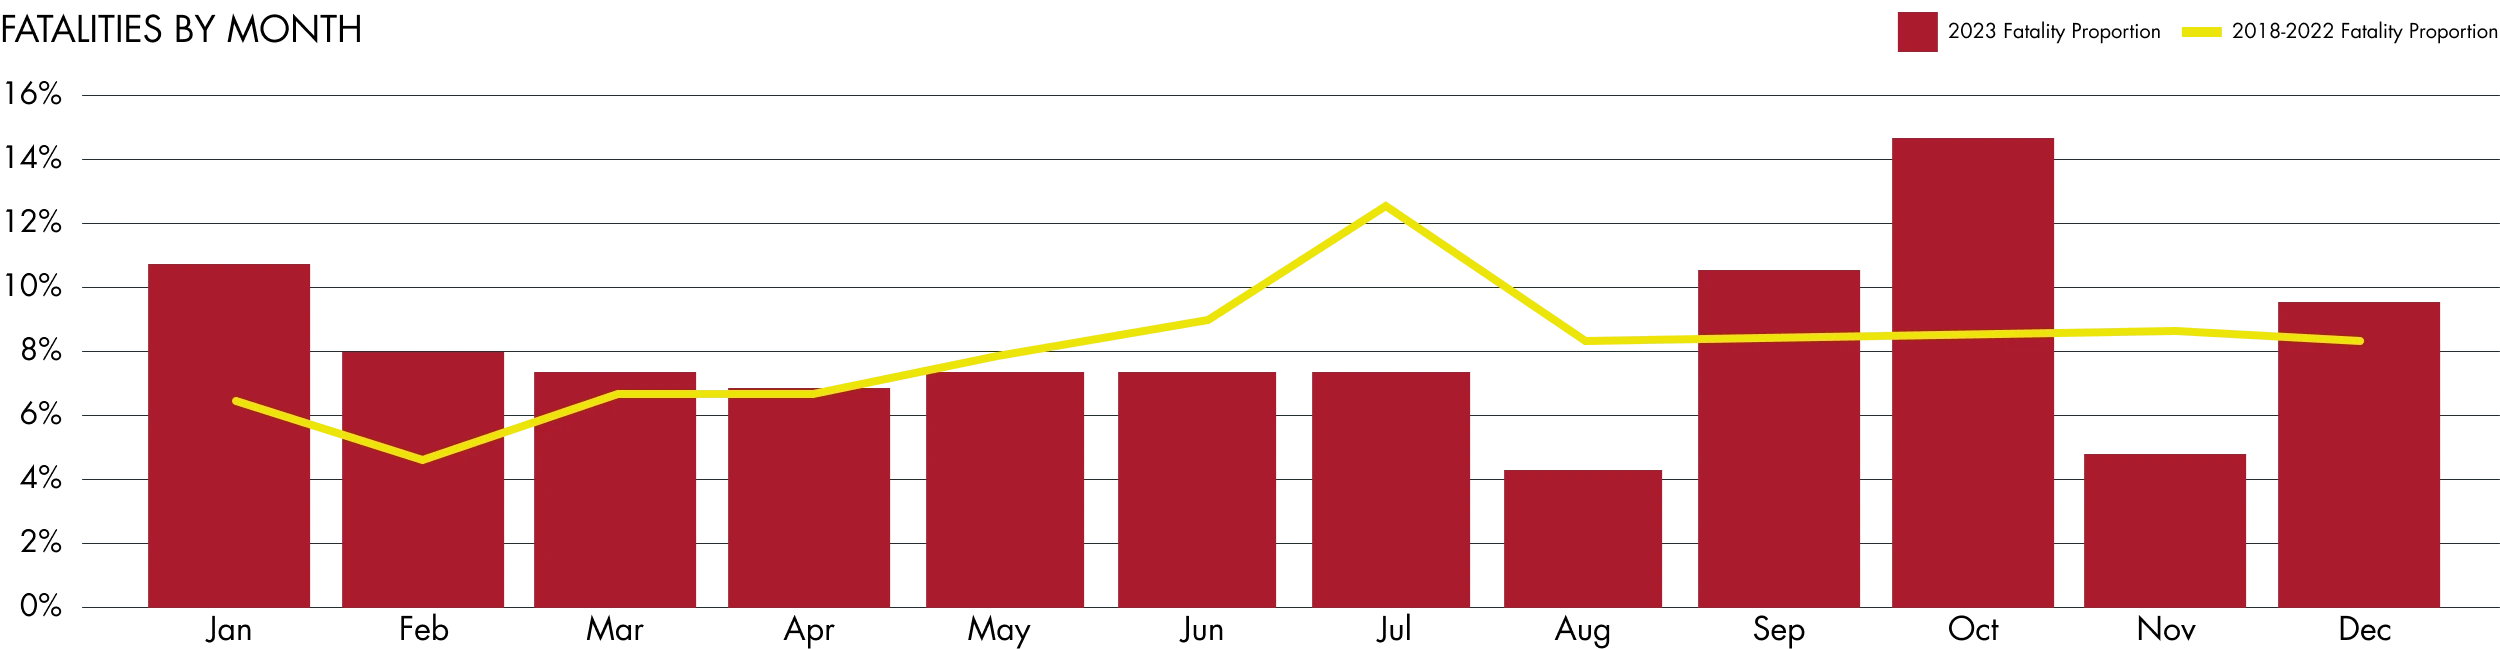
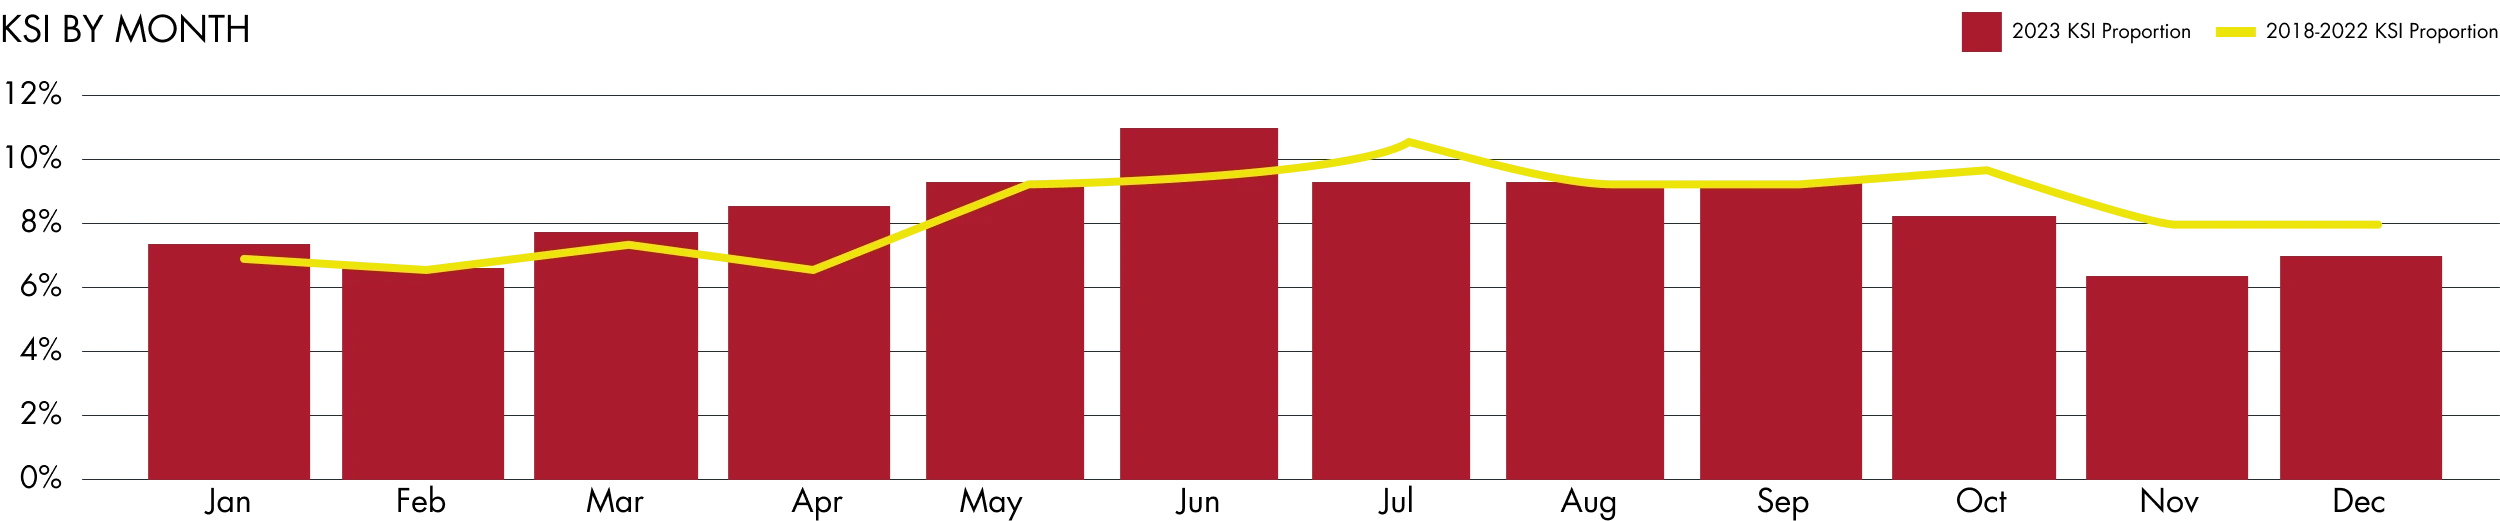
When Crashes Most Often Occur
Statistics show the prevalence of car accidents by month, day of the week, and time of day. In 2023, fatal auto wrecks in Chicago most commonly took place during the Fall and Winter months, specifically January, September, and October. However, there was a sudden drop in November, breaking this trend.
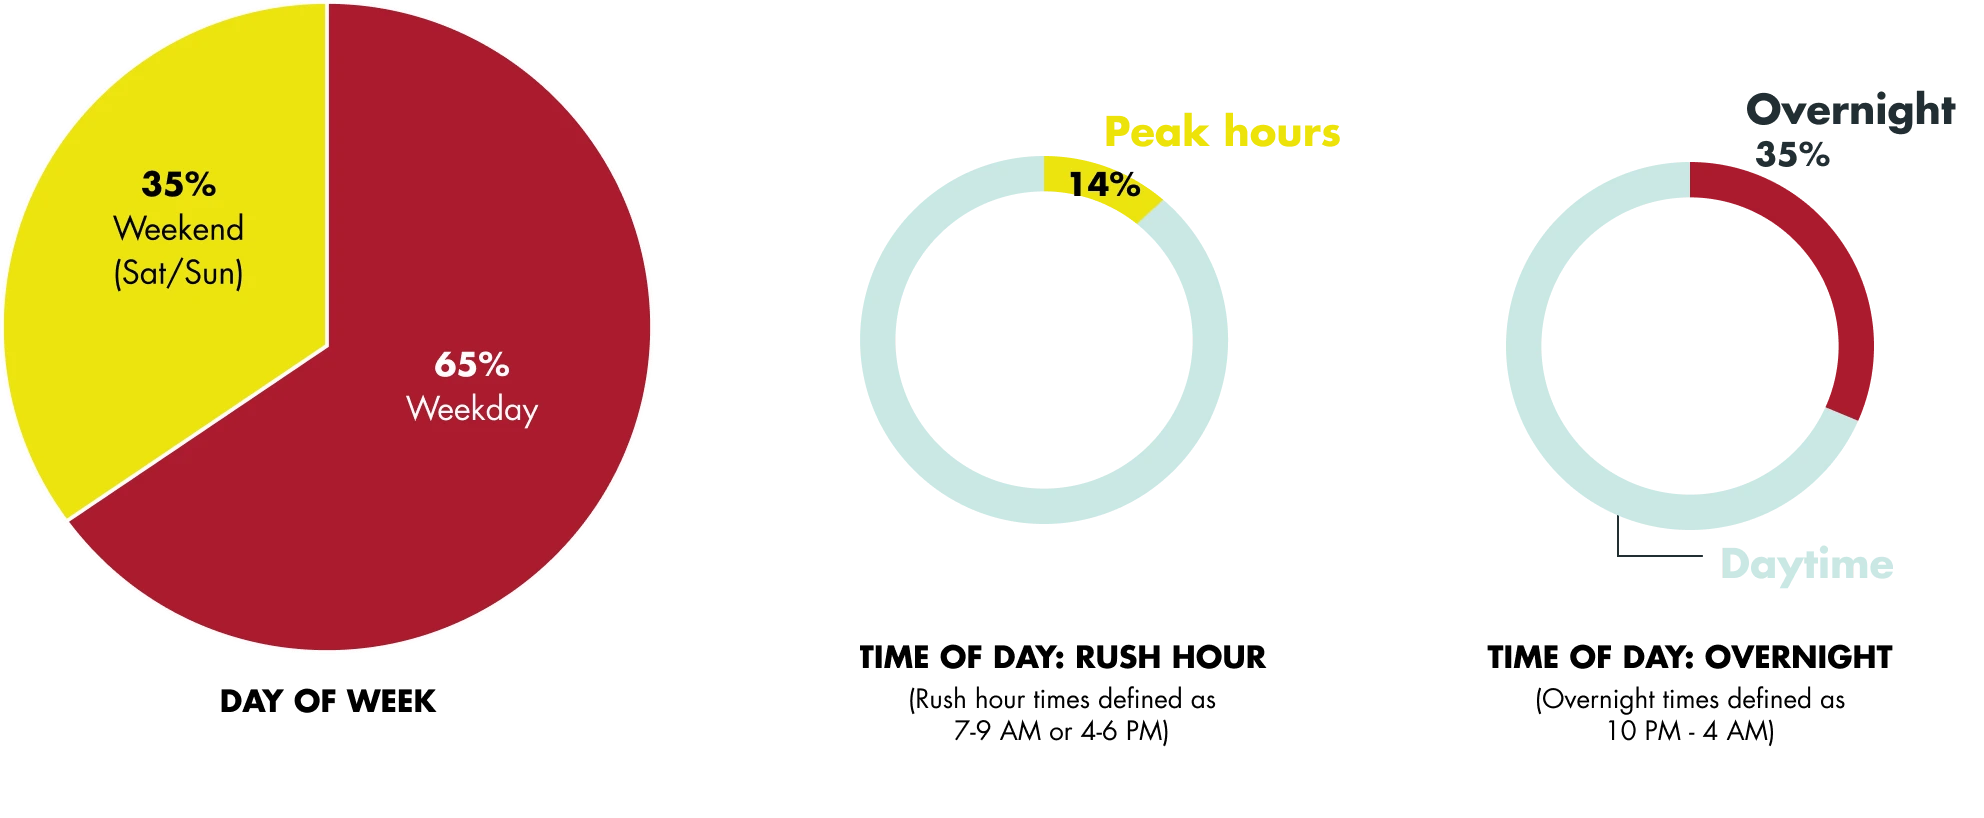
Additionally, in 2023, 63 percent of fatal crashes occurred on weekdays, with 14 percent occurring during rush hour. In contrast, 35 percent of accidents happened at night between 10 p.m. and 4 a.m. While these statistics can make Chicago drivers more aware of the times collisions are more likely to occur, it is always important to be hypervigilant and aware while on the road.
FATAL CRASHES BY DAY AND TIME
KSI CRASHES BY TIME OF DAY AND DAY OF WEEK
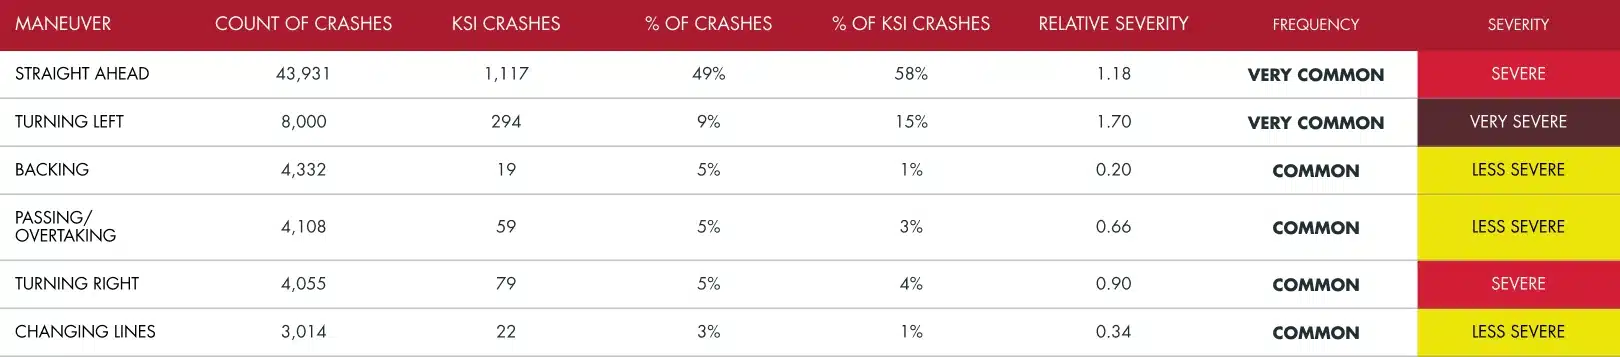
The Most Common Ways Crashes Take Place
Auto collisions can take place in any number of ways. The statistics for Chicago showcase the most common types of maneuvers that resulted in a car accident.
Straight Ahead Accidents
The majority of serious accidents resulted from a so-called “straight-ahead” wreck. These maneuvers made up 49 percent of all crashes in 2023. Straight ahead collisions can include head-ons, single-vehicle wrecks, and rear-ends.
These incidents happen when a car collides with another vehicle or object in its path, whether because the driver does not stop the vehicle in time, runs through an intersection, or skids off the road and hits a barrier.
Turning Left
Over 8,000 severe or fatal car accidents in 2023 involved a car turning left, accounting for 9 percent of all crashes. These collisions are especially dangerous as they can involve pedestrians and bicyclists, both of whom lack the outer shield required to protect them from the impact of a moving vehicle.
Backing
More than 4,000 vehicle accidents resulting in serious or fatal injuries occurred when a vehicle was backing up. These incidents are common in parking lots and garages, where visibility can be limited and there is a lot of movement. Unfortunately, it is not uncommon for these collisions to involve pedestrians making their way to and from their cars in a parking area.
KSI CRASHES BY TIME OF DAY AND DAY OF WEEK
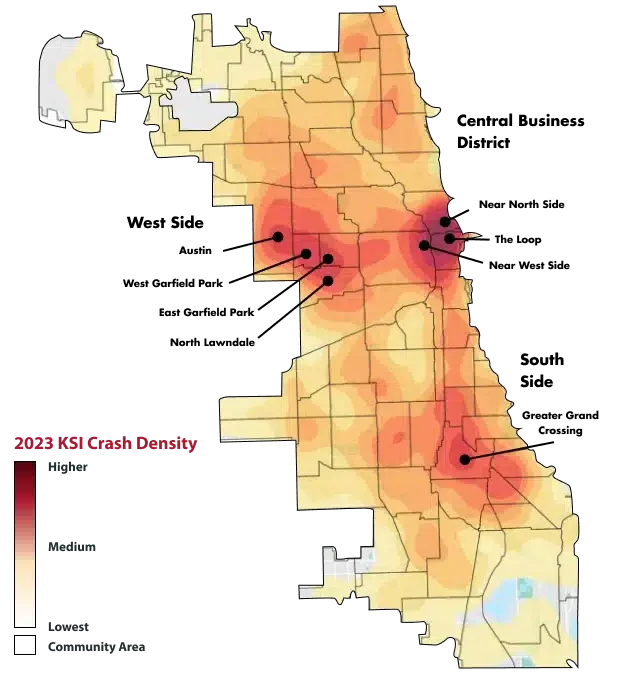
The Location of Crashes
In 2023, the highest proportion of crashes resulting in fatalities or serious injuries occurred on arterial streets, which are local roads or streets. These accounted for 34 percent of the incidents. This is primarily due to the high traffic volumes and average speeds of these roadways, which are 30 to 50 mph.
Collector roads, which are low-to-moderate-capacity roads that transport traffic from local streets to arterial roads, were responsible for 29 percent of crashes resulting in serious or fatal injuries in Chicago. Milwaukee Avenue is one example of a collector road.
FATAL CRASHES
KSI CRASHES
Forty-seven percent of severe or fatal collisions occurred at intersections. For crashes resulting in a pedestrian’s death, 46 percent took place in a crosswalk.
Collector roads, which are low-to-moderate-capacity roads that transport traffic from local streets to arterial roads, were responsible for 29 percent of crashes resulting in serious or fatal injuries in Chicago. Milwaukee Avenue is one example of a collector road.
FATAL CRASHES
STREET LOCATION OF PEOPLE KILLED WHILE WALKING
Chicago car accident stats break down these incidents by street jurisdiction, including state, county, and city. Eighty-nine percent of the road network is under the city’s jurisdiction. Thus, it comes as no surprise that roads under the city’s jurisdiction accounted for the largest share of serious and fatal accidents. In 2023, 70 percent of crashes resulting in a death or serious injury took place in the city, with 48 percent of all fatal accidents occurring there.
In addition, the state has jurisdiction over 9 percent of the road network. State roads saw 24 percent of all crashes resulting in death or serious injury and 45 percent of all fatal cases.
Only 2 percent of the road network is under the county’s jurisdiction, and those roads accounted for 6 percent of accidents resulting in serious and fatal injuries.
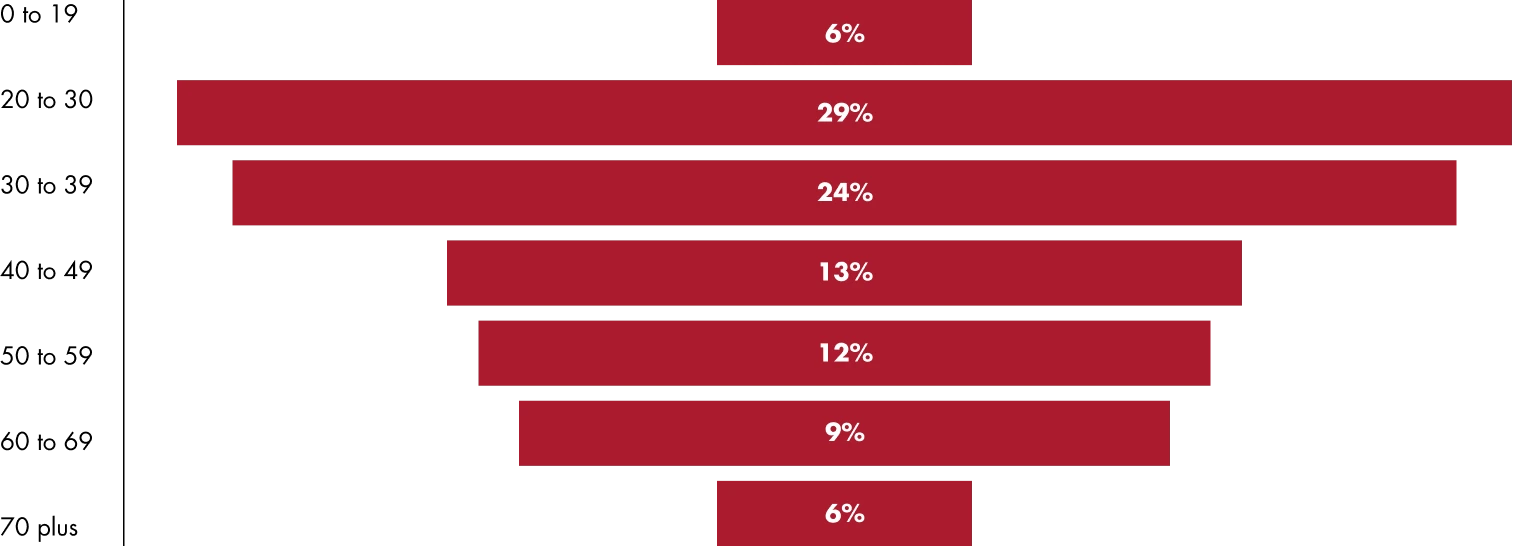
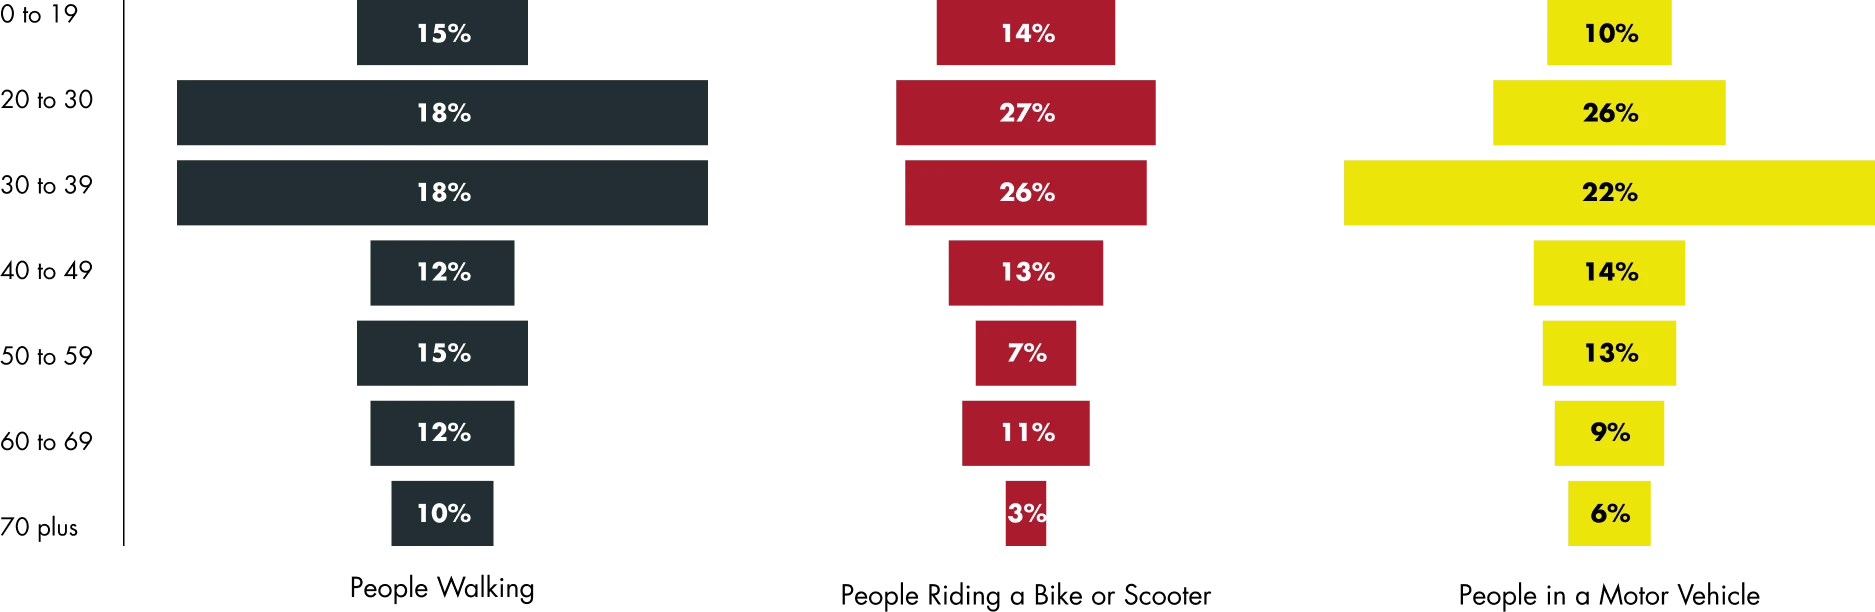
The majority of individuals involved in a crash resulting in serious or fatal injuries were 20 to 30 years of age. Similarly, the striking vehicle in an accident was usually a passenger vehicle, including collisions with other vehicles at 57 percent, people riding a bike or scooter at 80 percent, and people walking at 48 percent.
AGE DISTRIBUTION OF STRIKING DRIVER IN A KSI CRASH
AGE DISTRIBUTION OF VICTIM IN A KSI CRASH BY MODE
47% of people killed while walking were struck less than one mile from their homes.
Accidents involving pedestrians have a significantly higher risk of fatalities. In 2023, 47 percent of people killed while walking were struck less than one mile from their homes.
Identifying & Addressing Key Issues in Chicago Car Accidents
In 2024, CDOT published the Chicago Traffic Crashes Annual Report. A thorough crash review and analysis allowed CDOT to identify traffic safety trends that play a decisive role in severe crashes.
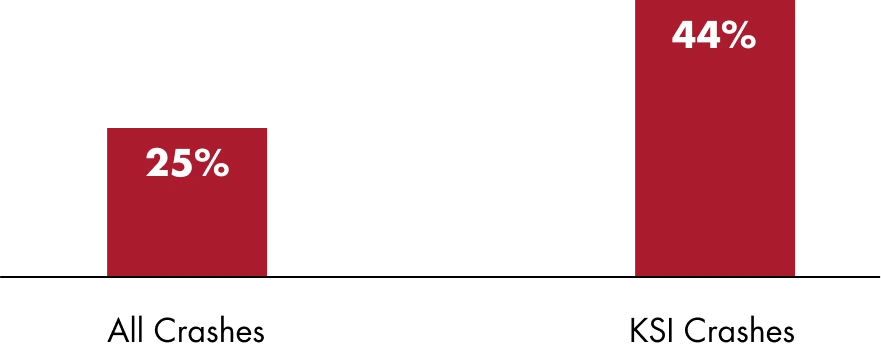
Key Issue 1: Speed & Size
The speed and size of a vehicle can amplify the severity of injuries in a traffic collision. For example, accidents involving a semi-truck can have more severe consequences, especially if the crash also involves a smaller passenger vehicle, motorcycle, bicyclist, or pedestrian.
In 2023, 48% of pedestrians killed in Chicago were hit by an SUV or larger vehicle.
A street wider than 50 ft has 14x mote fatal crashes per mile than a street narrower than 50 ft.
Key Issue 2: Reckless Driving
Those who drive recklessly put others on the road at greater risk of harm. Reckless driving can involve any type of behavior that violates traffic laws and the rules of the road, such as the following:
Distracted driving, such as texting, talking on the phone, putting on makeup, etc.
Aggressive driving and speeding
Not adhering to traffic signs and signals
Not yielding the right-of-way
Driving under the influence of drugs or alcohol
Driving fatigued
84% of traffic fatalities involved reckless or egregious driving behavior.
18% of traffic fatalities involved disregarding stop signs and traffic signals.
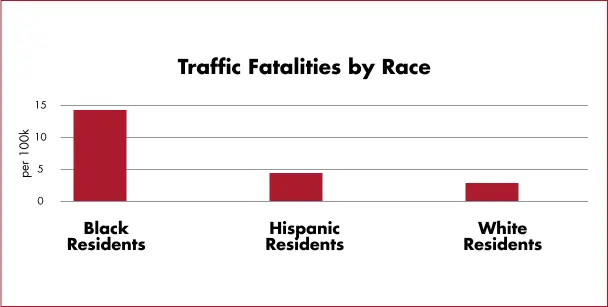
Key Issue 3: Persistent Inequities
In Chicago, those facing the starkest inequalities in health, economic struggle, and community violence are most at risk of dying in traffic accidents, regardless of the circumstances. For example, those who live in under-resourced neighborhoods may have less access to quality health care, stable employment, and safe outdoor spaces, heightening the impact of an auto collision.
These areas may also have poorly maintained infrastructure, lack pedestrian-friendly streets, and have inadequate lighting, all of which can contribute to the greater likelihood of an accident.
Crash Trends in 2023
Chicago car accident statistics cover crash trends by year and mode. The trends for 2023 show the following:
Killed in a Car Accident
80 motor vehicle drivers
46 pedestrians
10 bicyclists
136 overall fatalities—down from 160 in 2022 and 186 in 2021
Seriously Injured in a Car Accident
1,583 motor vehicle drivers
454 pedestrians
164 bicyclists
6 percent reduction in serious injuries from 2021
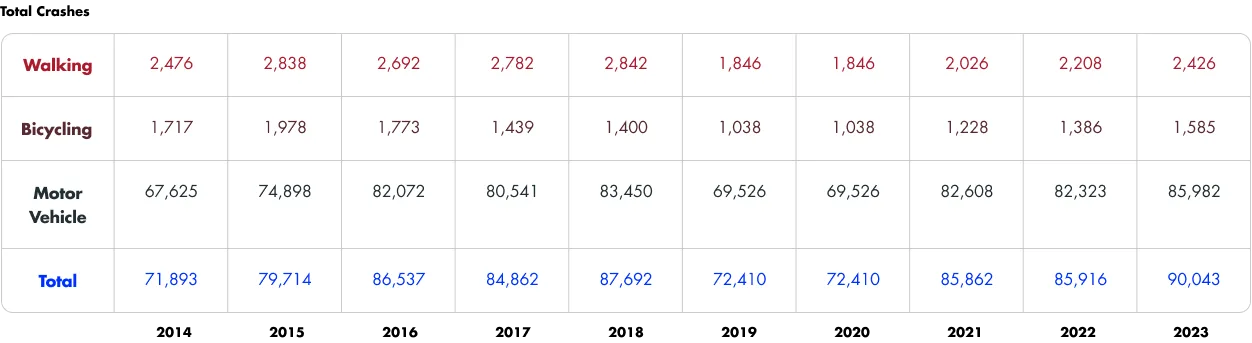
The total number of crashes in 2023 was 90,043, nearly 5,000 more than in 2022 and a record high in the past decade.
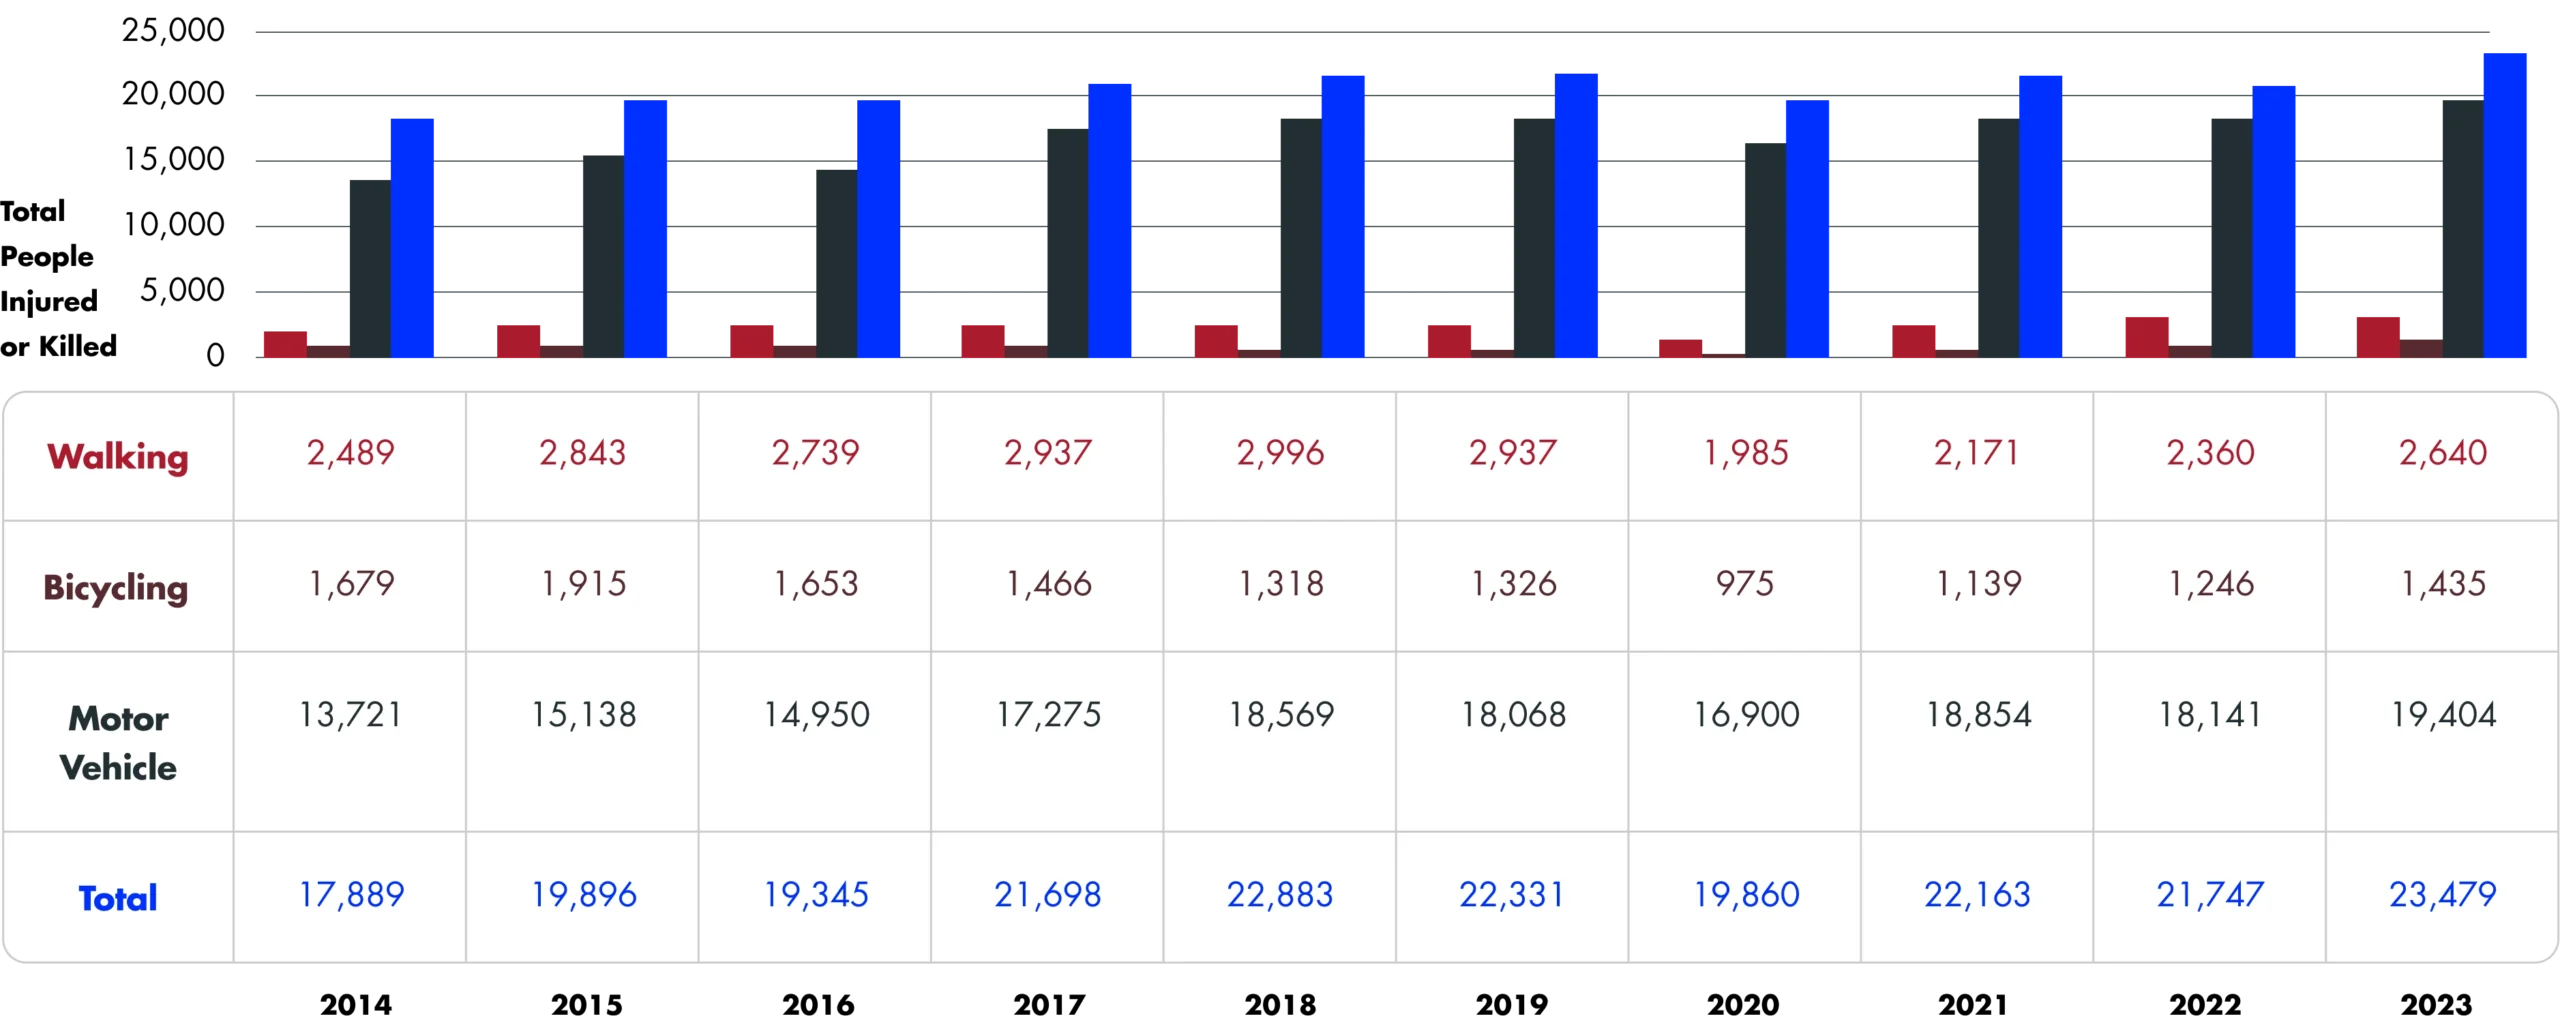
Chicago Crash Trends by Year
Data for 2014-2023 are from IDOT: Non-fatal crashes classified as NMV are assumed to be pedestrians; Data inclusive of bicycle dooring crashes reported by IDOT
Resources After a Car Accident
You may be unsure of where to turn following a serious car accident. Our compassionate personal injury attorneys can provide the support you and your loved ones need during this challenging time.
Numerous forms of damages can add up in the aftermath of a vehicle collision, including medical bills, lost wages, and emotional trauma. Our legal team can help calculate your losses and pursue a damage award from the at-fault party in a claim or lawsuit.
Mental Health Support
A vehicle crash can affect more than your physical well-being. These incidents can significantly impact your mental health, especially when they result in serious, life-changing injuries. A 2022 case study found that one in six victims of car accidents develop moderate mental health symptoms, including depression and post-traumatic stress disorder.
Our team can help lift the burden by taking on the legal complexities of your case while you focus on your family and recovery. Contact Illinois Hammer Injury Lawyers today for more information.
Seek Legal Assistance After A Chicago Car Accident
When you or your loved one has been in a collision, talk with a personal injury lawyer sooner rather than later. There are filing deadlines you may be unaware of that can impact your ability to secure compensation.
Our award-winning car accident attorneys will build your case, file your claim on time, and fight for the compensation you deserve. The Illinois Hammer is the law firm to turn to for high-quality representation from a knowledgeable team that truly cares about your well-being. Contact us today by filling out our online form or calling us at 888-742-6637.